Physics of Stock Market Crash
 In a recent article "Criticality and Phase Transition in Stock-Price Fluctuations" published in Physical Review Letters (February 17, 2006), a University of Tokyo team consisting of Ken Kiyono, Zbigniew R. Struzik and Yoshiharu Yamamoto reports about their research findings that in the months before and after a major stock market crash, price fluctuations follow patterns similar to those seen in natural phenomena such as heartbeats and earthquakes.
The researchers studied the Standard & Poor's S&P 500 index, focusing on small deviations from long-term index trends. Such up-and-down blips in stock prices are usually "Gaussian," or "normally" random, at least when measured over sufficiently long time scales -- for example, for more than one day. That means that fluctuations are likely to be small, while larger fluctuations are less likely, their probabilities following a bell curve.
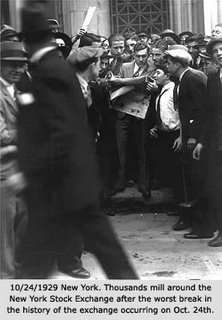
But when they looked at 2-month periods surrounding major crashes such as the Black Monday event of October 19, 1987, they saw something different: Fluctuations of all magnitudes were equally probable. As a consequence, the graph of index fluctuations looked statistically similar if plotted over different time scales, anywhere between time scales of 4 minutes and two weeks. Such behavior is called critical in analogy with a ferromagnetic metal at the "critical temperature," when regions form where the metal's atoms arrange their spins in the same direction, and these regions look similar at different levels of magnification. This self-similarity is also seen in the time intervals between heartbeats, or between earthquakes. Mathematically, however, the stock market case differs in that the probabilities do not change with the size of the event, while in other cases of non-critical self-similarity, the probabilities usually follow a so-called power law.
It is still unclear which individual trading decisions lead to criticality in the stock market or whether the findings could one day lead to an early-warning system to predict crashes. If such predictions can be made with certainty, we hope the uncertainty in Physics research budgets would vanish for ever ;-)
Labels: Complex System

0 Comments:
Post a Comment